
Metroltek is pleased to announce ChartReporter, a collection of LabVIEW VIs or Python functions organized in a project to perform advanced tasks for automatic test or ant data data analysis applications. The functionality categories include:
- Data Visualization and Analysis: BoxPlot, Correlation, ErrorBar, Histogram, Pareto Chart, Percentile Plot, Run Plot, Significance Testing (between mean values)
- Metrology: Measurement Uncertainty, Type 1 Gage Study, Calibration Report, Instrument Accuracy
- Derived Charts: Normal Distribution, Uniform Distribution
As a developer in LabVIEW or Python, have you ever wanted to create full featured statistical reports by simply passing in data and a few settings into a driver interface. ChartReporter lets you do this for a wide variety of commonly needed report types. An overview of the process architecture is shown below showing a Histogram example:
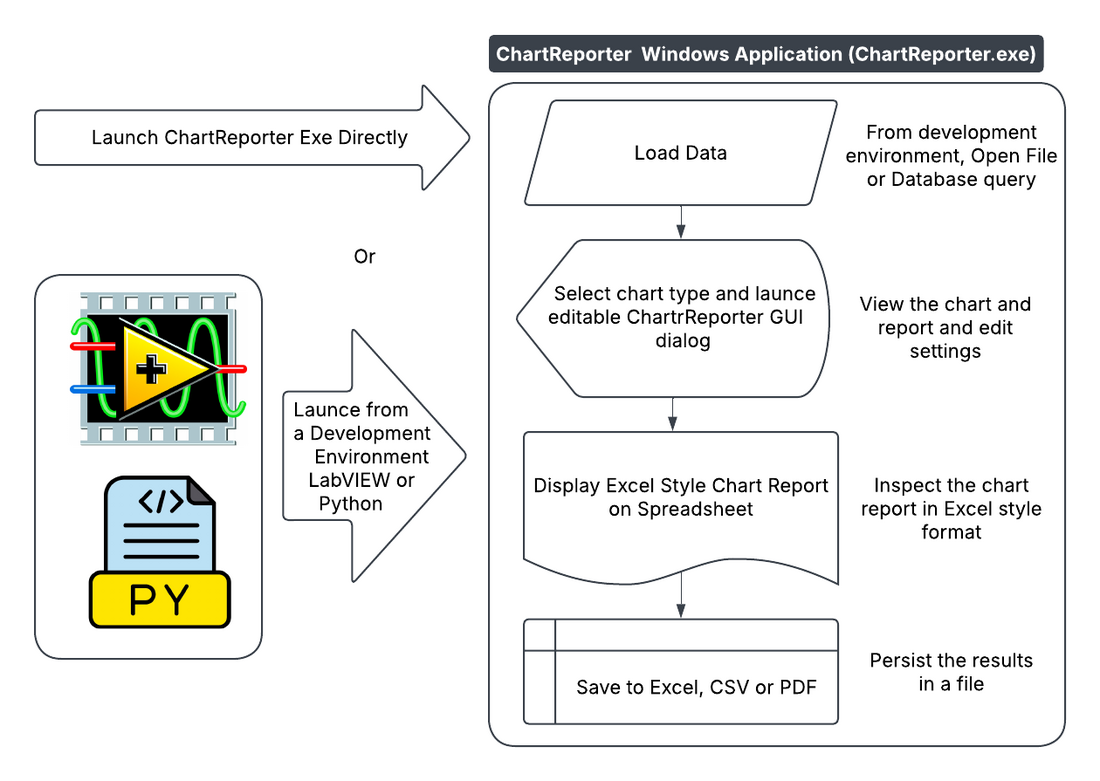
ChartReporter provides for running from an external software program such as LabVIEW or Python or running it as a standalone application.
The example below demonstrates creating a histogram report from LabVIEW using the ChartReporter Toolkit:
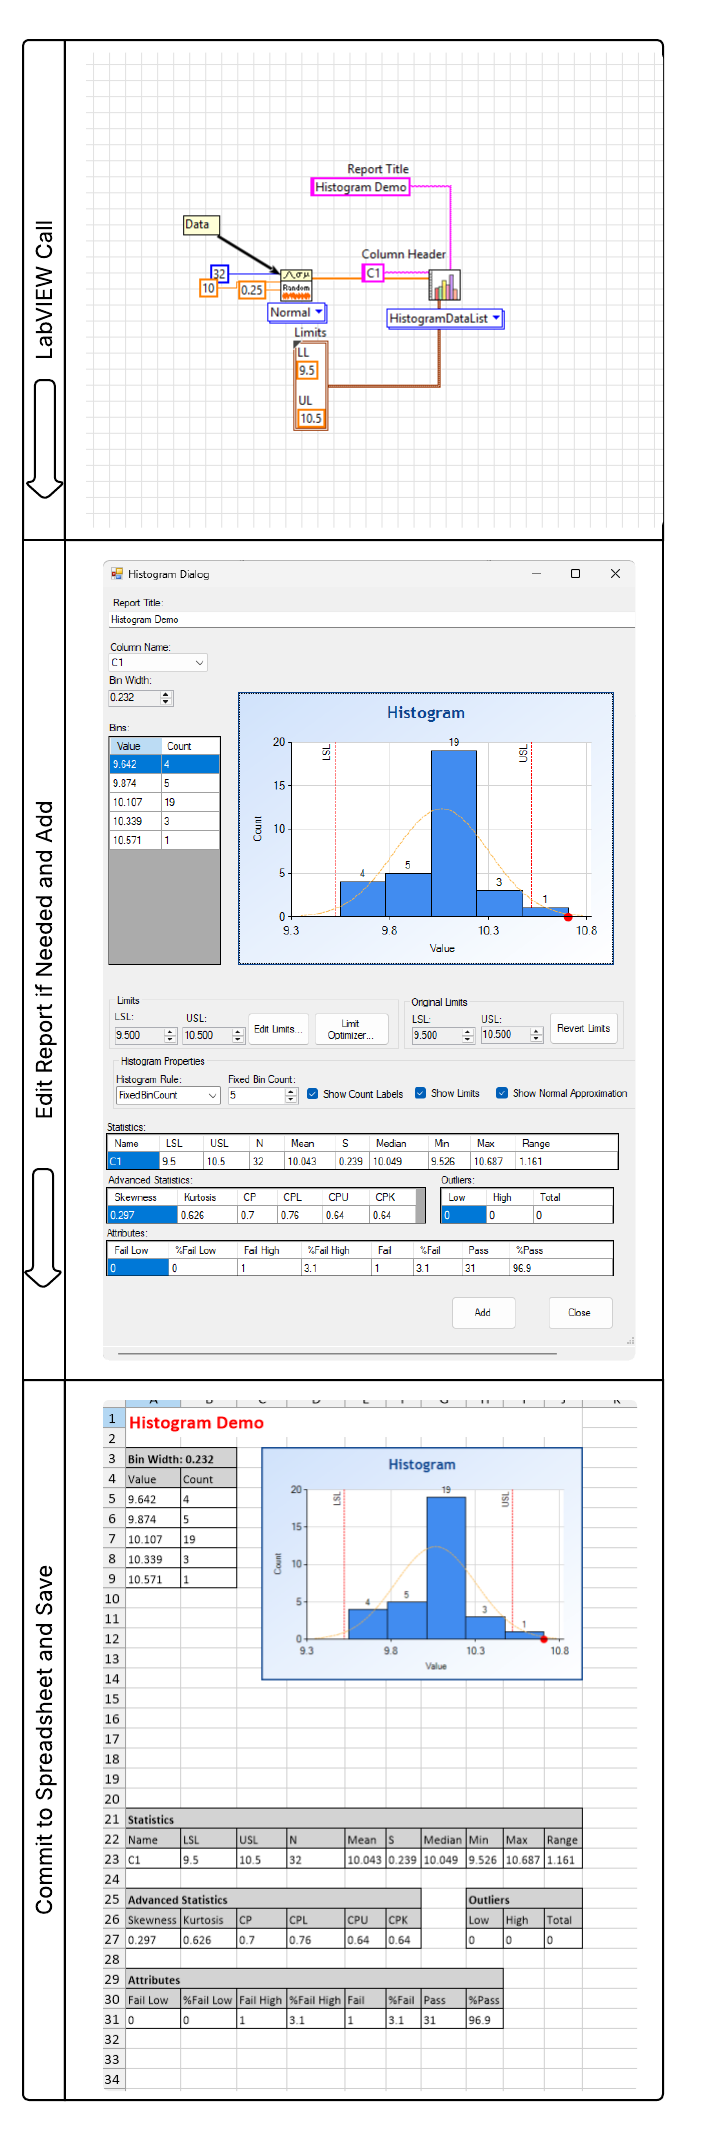
After completion the program returns to the LabVIEW calling VI. Example code for using Python instead of LabVIEW is shown below, the remaining steps of editing the report or copying to a spreadsheet are identical.

A User Guide link is shown below to view more details of ChartReporter in a PDF.
Follow the link to see a YouTube video demonstrating running a LabVIEW ChartReporter Histogram demo: youtu.be/hdt-JoD_8nM